Our xG Model
Expected Goals (xG) measures the probability of a shot becoming a goal, based on where and how it was taken. We built our own model because the EIHL's built-in xG sometimes over- or underestimates shot quality.
What is xG?
Every time a player shoots, the puck has some probability of going in. A shot from right in front of the net might have a 25% chance. A speculative shot from the blue line might have a 2% chance. xG assigns that probability to each shot.
Sum up the xG for all shots in a game and you get Expected Goals — a measure of how many goals a team should have scored based on the quality of their chances, regardless of whether the puck actually went in.
Why we built our own
The EIHL provides xG values with their shot data, but we found our model performs better on every metric we tested. Using the full 2025 season as a holdout test set (261 games):
78.5% of the time, the team with higher Tracker xG won the game — compared to 72.0% using the league's xG.
| Metric | EIHL xG | Tracker xG |
|---|---|---|
| Log Loss | 0.1987 | 0.1929 |
| Brier Score | 0.0521 | 0.0513 |
| ROC AUC | 0.7749 | 0.7936 |
| Game-Level MAE | 1.400 | 1.230 |
| Winner Prediction (all) | 72.0% | 78.5% |
| Winner (regulation) | 76.5% | 81.6% |
| Winner (OT/SO) | 58.5% | 69.2% |
What goes into it
Our model uses 26 features organised into three tiers. An XGBoost model processes these features, then a goalie quality adjustment is applied on top.
Angle to goal
Off-centre distance
Behind goal line
In the slot
In the inner slot
Period & time
Rebound (within 3s)
Rebound off save
Shot pressure (30/60s)
Rush / transition
Home/away
Possible empty net
Shooter season shooting %
Rolling 10-game form
PP specialist ratio
Opponent defensive quality
Opposing goalie quality
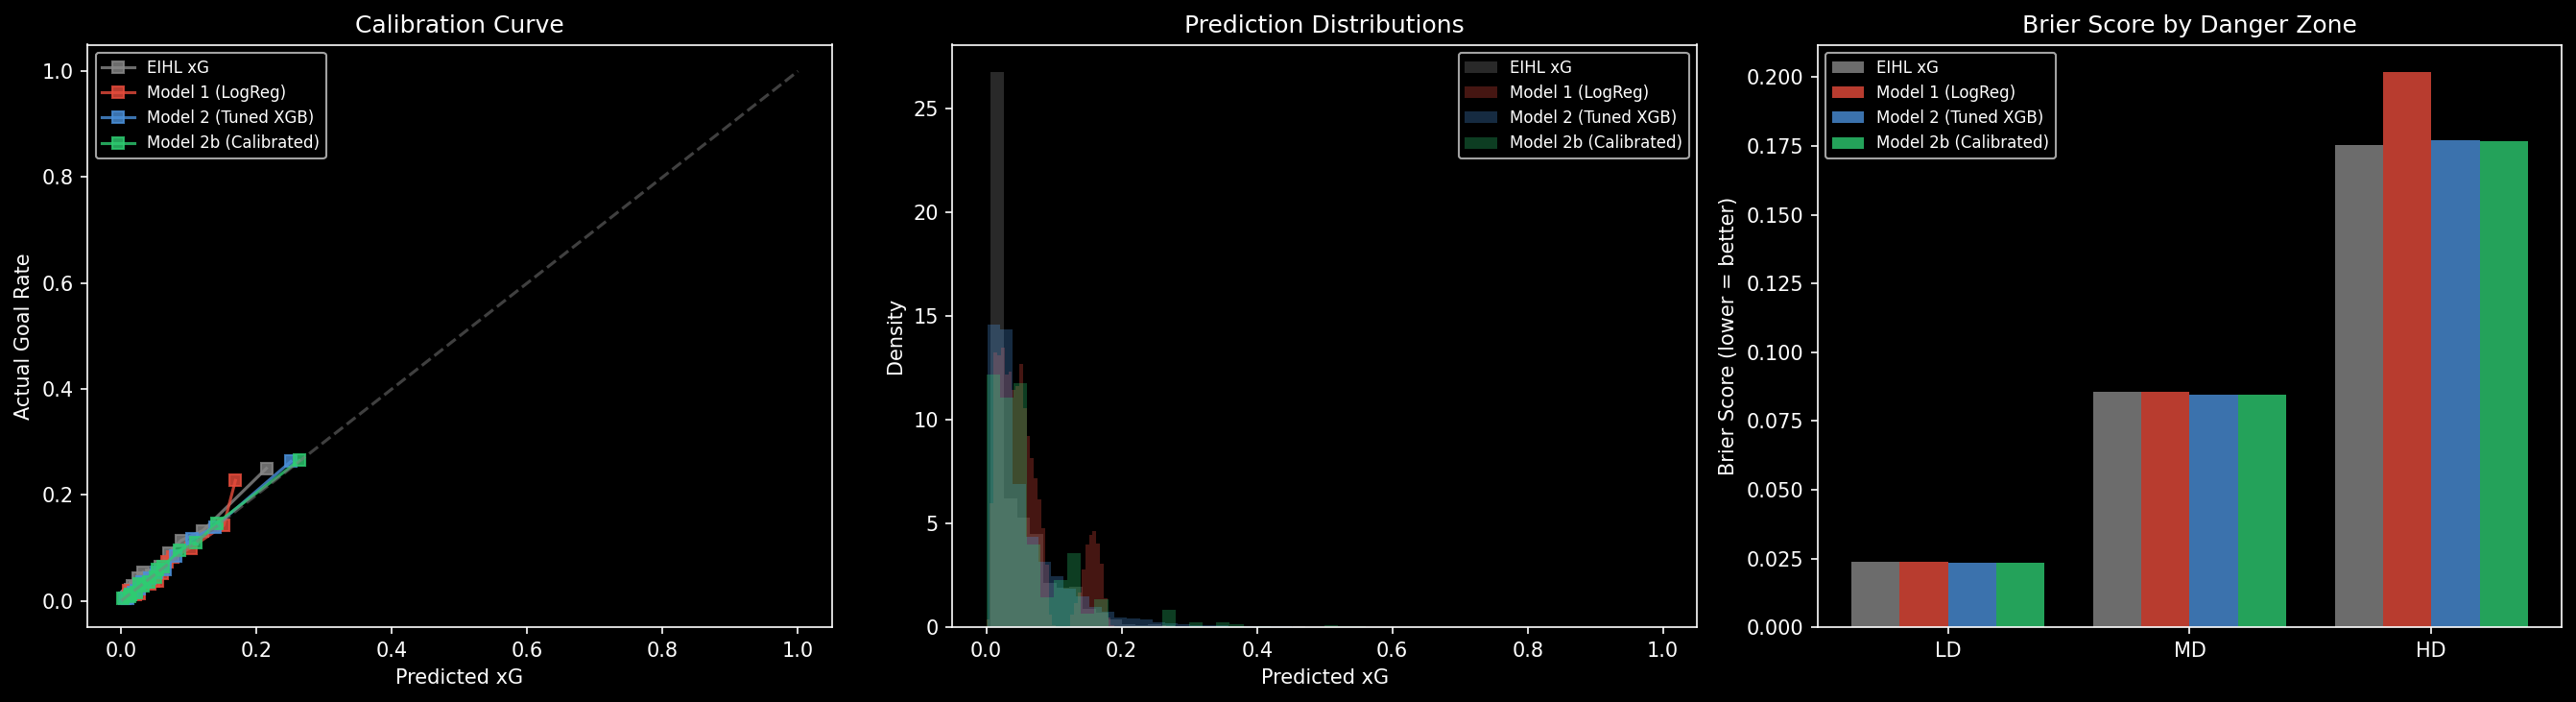
How it compares
Calibration curves show how well predicted probabilities match reality. A perfectly calibrated model follows the diagonal — when it says "10% chance of a goal", goals happen 10% of the time.
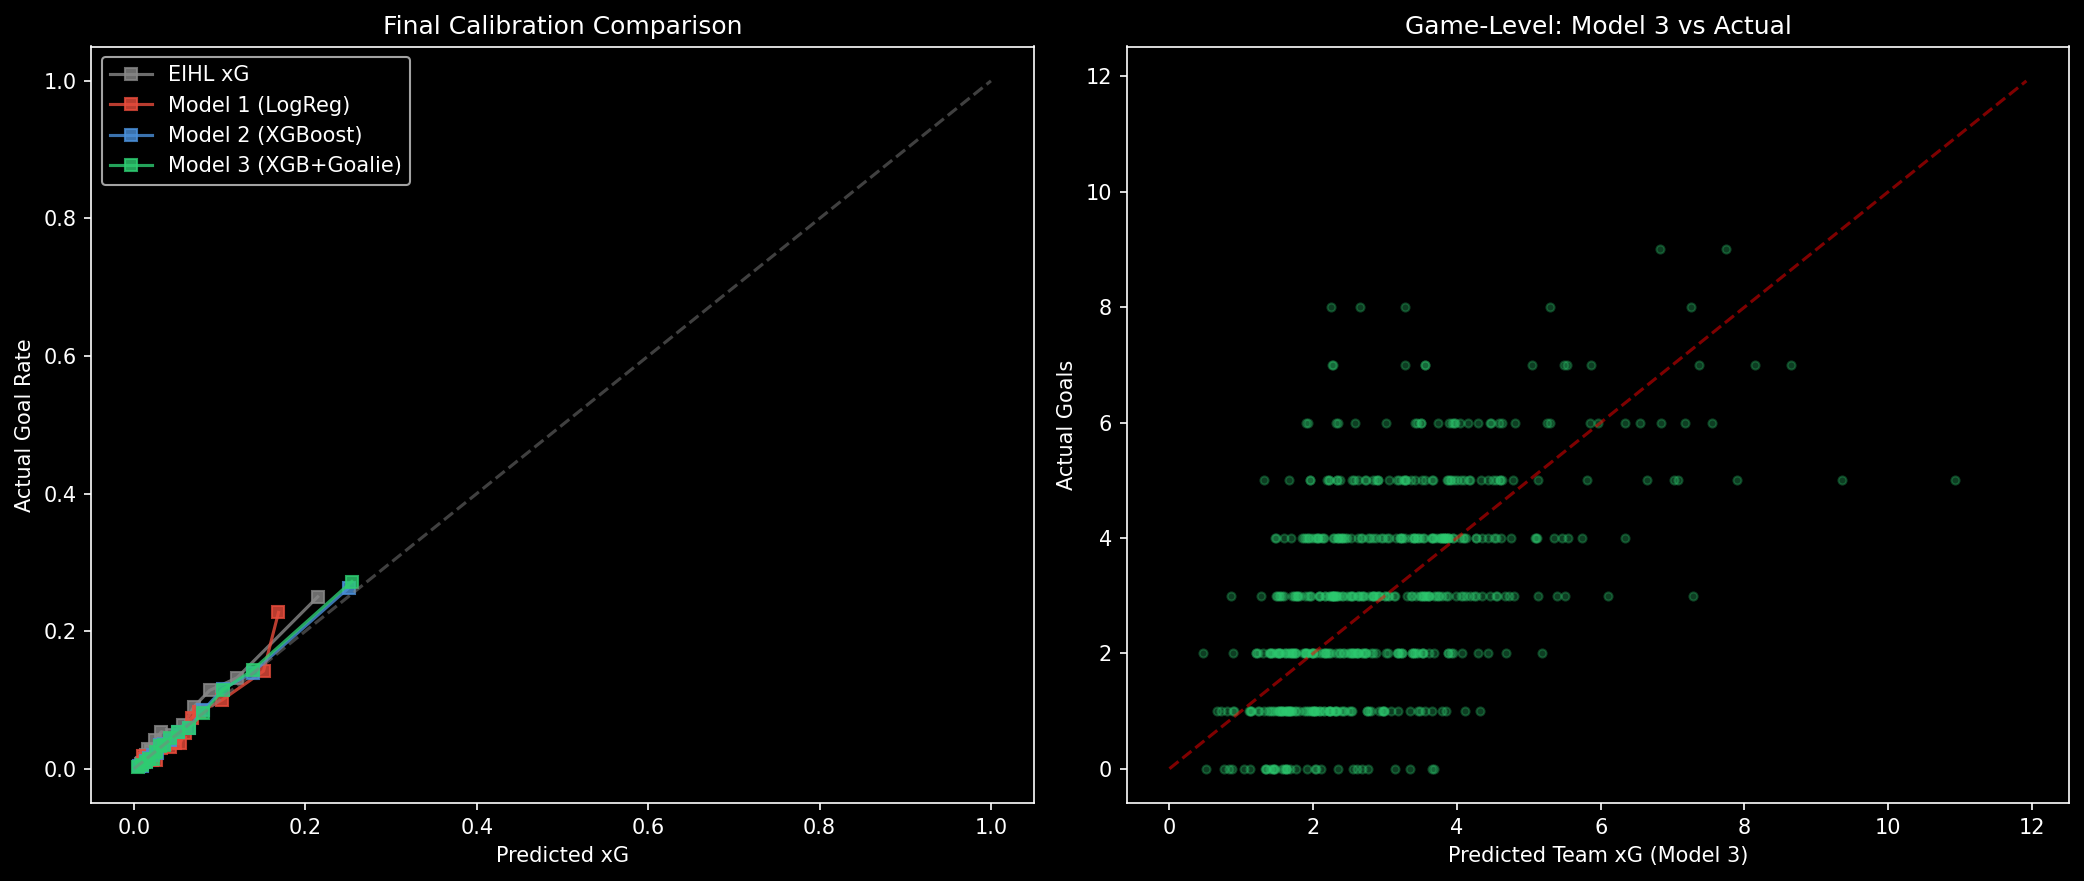
Our model also produces tighter predictions at the game level, with better-separated distributions across all danger zones.
Technical details
The model is an XGBoost gradient-boosted tree trained on 116,882 shots from the 2021–2024 seasons, tested against a held-out 2025 season (26,222 shots). Hyperparameters were tuned via randomised search with time-series cross-validation.
A goalie adjustment layer scales the base xG by the opposing goalie's save percentage relative to the league average, so shots against strong goalies get a slight reduction and vice versa. This is recalculated each time the data syncs.